
Overview
Network Olympus is designed for detailed monitoring of computers, servers, and network devices. It provides continuous oversight of individual systems and local networks, making it ideal for environments that require reliable monitoring. As top-tier computer network monitoring software, it helps ensure system uptime, promptly identifies potential issues, and supports automated responses through configurable actions and detailed failure reports.
Regular monitoring of server health enables administrators to detect and resolve issues before they impact end-users, ensuring a seamless and uninterrupted experience. Moreover, by analyzing historical data and trends, administrators can make informed decisions regarding capacity planning, resource allocation, and infrastructure upgrades, ultimately leading to improved system performance and scalability.

Network Olympus guarantees system uptime, promptly identifies potential issues, and then notifies you about them. It efficiently resolves these issues and provides detailed reports on failures, thereby ensuring timely management.

Utilizing the WMI protocol, Network Olympus offers extensive capabilities for monitoring a wide array of server metrics, encompassing everything from system performance and availability to files and folders’ existence and size. All of the data is captured and analyzed in real-time to provide up-to-date information.

The web mapping feature in Network Olympus graphically illustrates all the components of your system, including their interconnections. It automatically updates the status of each sensor, enabling comprehensive device monitoring through an integrated map. By using the network map feature, you can easily select any device on it and receive an immediate monitoring report.
Scanning
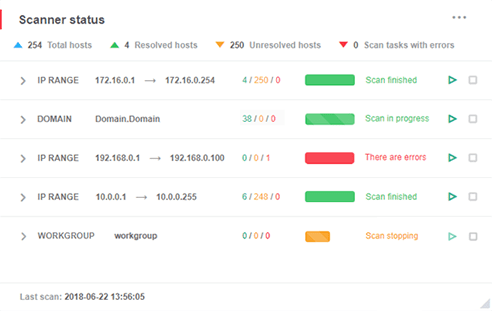
Network Olympus features an advanced built-in scanner module that is expertly designed for initial data collection. This module meticulously scans every device within the network, gathering essential data. Each device it identifies is seamlessly integrated into your database, setting the stage for continuous monitoring and management.
The intuitive interface of Network Olympus simplifies the complex task of system management. It provides a clear and comprehensive view of your entire network environment. The software includes user-friendly web maps and hierarchical trees that are instrumental in achieving streamlined automation and effective visualization. These tools not only simplify the workflow but also enhance the efficiency of network management, making it accessible even to those with minimal technical expertise.
Sensors
Network Olympus harnesses a variety of monitoring sensors to establish connections with devices and gather essential data. These sensors delve into a wide array of system aspects through various protocols. The software can execute predefined actions in response to detected issues, making it efficient network monitoring solution. With over 30 sensor types grouped into System, WinBase, NetBase, and FileSystem categories, Network Olympus provides comprehensive monitoring across your network environment.
With Network Olympus, monitoring the health and performance of your Windows operating system is straightforward. The WinBase and System sensors help ensure stable OS operation by monitoring the following parameters.
CPU load: Monitor processor load in real time to prevent it from reaching critical levels.
Memory usage: The memory sensors are highly adaptable and easy to configure, allowing you to effectively monitor both physical and virtual memory usage.
User & Process count: Keep track of the number of processes running and users logged in on any remote computer.
Monitoring resources within and beyond the local network is crucial. NetBase sensors allow you to monitor a wide range of ports and website availability, including protocols such as TCP, ICMP, FTP, HTTP, POP3, SMTP, Telnet, IMAP, and more.

Network Olympus provides comprehensive file system monitoring capabilities. It goes beyond operating system metrics to track file and folder parameters across your environment. You can monitor and compare attributes such as file size, existence, CRC32 checksums, file count, disk space usage, and file content.
Actions
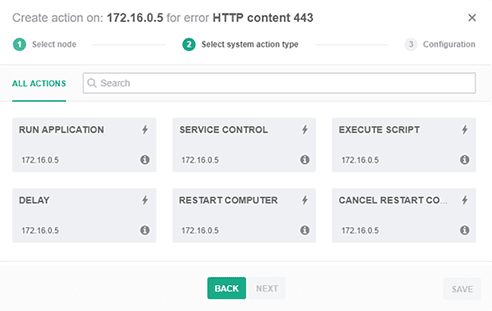
Network Olympus can execute a series of predefined actions in response to any detected abnormalities. The software promptly notifies you of issues and initiates immediate measures to mitigate their impact. Depending on your customized settings, it is able to execute scripts, reboot remote computers, restart services, launch specific applications, and log event data for future analysis. In emergency scenarios, the program reacts based on sensor feedback and operational outcomes.
The Scenario builder feature in Network Olympus allows you to configure sequences of actions triggered by specific abnormalities. Thanks to its user-friendly interface, you can easily create complex combinations of sensor-based actions and notifications. All systems activities, including these actions, are meticulously logged in the Activity Log and detailed in special reports, thereby ensuring that no event is ever overlooked.

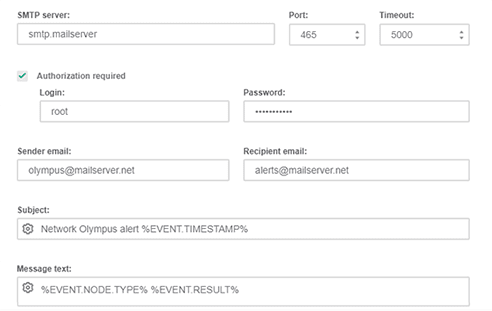
Integrating notifications with actions significantly enhances the efficiency of monitoring. These notifications serve as informative alerts, keeping administrators updated on every deviation in system status. Network Olympus provides a wide array of notification options, allowing for a fully customized monitoring experience.
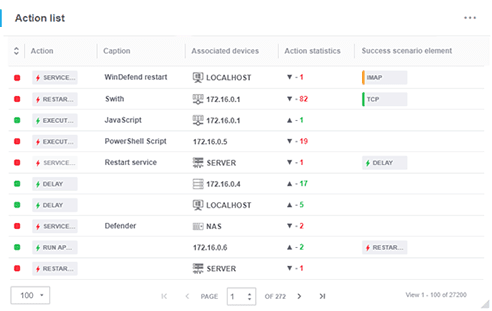
Network Olympus offers an extensive range of automated actions and alerts to help reduce system downtime. The software’s intuitive interface facilitates the setting of various actions, including:
Alerts: Message box, popup window, sound notification, write to file, email notification and more.
Actions: Launch application, run a script, restart a service, reboot a computer, and more.
All executed actions and detected parameter changes are continuously logged, providing a comprehensive and clear overview of the network’s status over time.
Scenarios
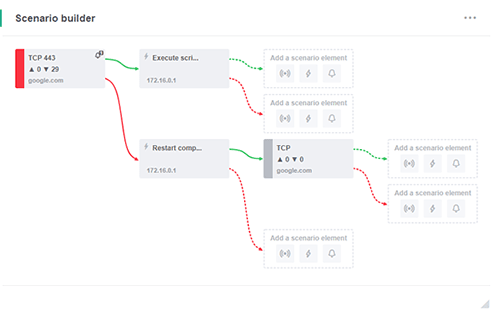
The Scenario builder in Network Olympus is a powerful tool designed to automate system workflows. It enables you to create and manage various monitoring scenarios, streamlining and optimizing the monitoring process.
It not only schedules monitoring processes but also offers extensive capabilities for responding to network emergencies and diagnosing problems effectively.
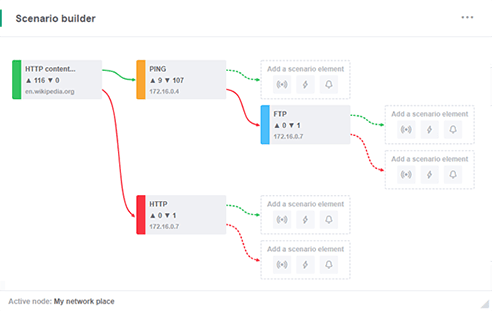
Scenario builder can create complex multi-branch scenarios for a consistent monitoring experience. Each branch is easily managed by adding notifications, sensors, and actions.
The intuitive interface makes it easy to create even complex scripts. The Scenario builder also allows you to assign monitoring scenarios to a specific device or a group of devices.
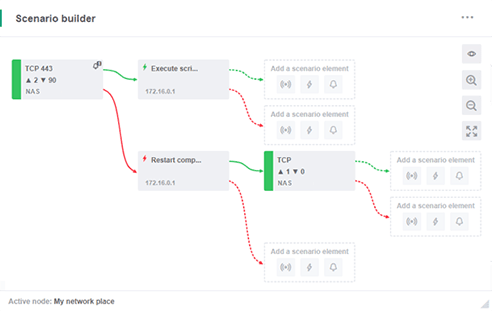
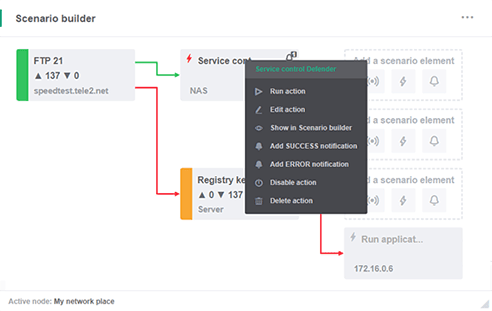
Scenario builder’s functionality is highly adaptable. It allows for the complete management of all the added sensors, actions, and notifications, enabling users to tailor their monitoring processes to their specific needs.
Network Olympus boasts a robust and secure monitoring structure that promptly detects malfunctions and averts potential disasters. Its sensor technology forms a logic chain that triggers system responses, ensuring timely notifications about the state of your devices. The software comprehensively logs the entire monitoring process, facilitating the easy tracking of issues and understanding their origins.
Scenario builder can be utilized in various ways to automate IT workflow scenarios.
Server availability check: regularly verifies server and website stability, alerting you immediately if any issues are detected.
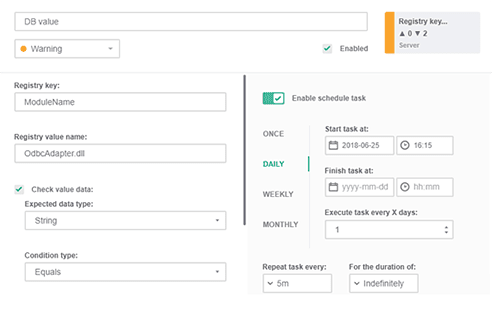
Registry key value check: monitors and restores the key values on remote devices if deviations are observed.
Online status check: keeps track of the status of all devices in a group, logging sensor data, and notifying administrators if a device goes offline, and provides detailed logs for each checking iteration.
Statistics
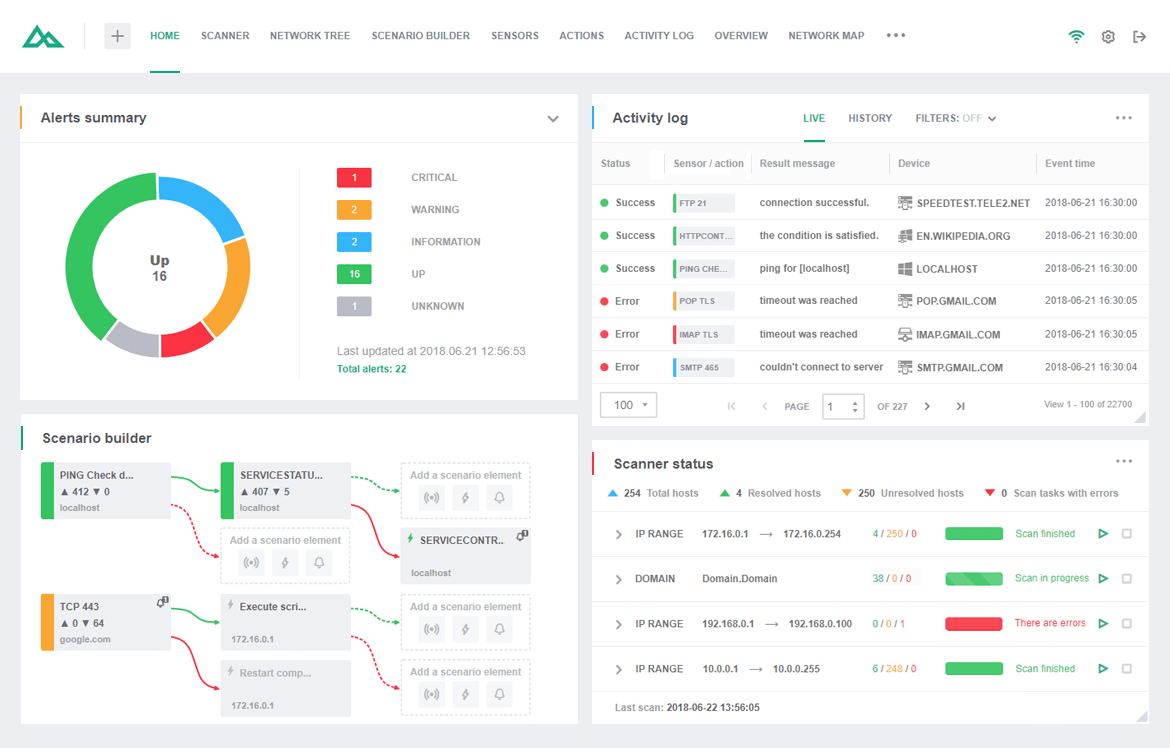
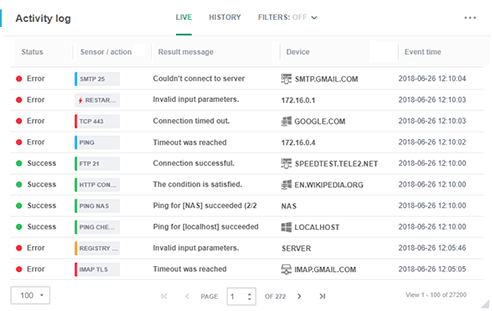
Network Olympus diligently tracks the status of all sensors and records every action taken, maintaining a comprehensive Activity Log. This network tracking software allows you to access data via the Activity Log widget to analyze processes and identify performance issues.

Monitoring data in Network Olympus can be viewed in two modes: Live and History. Live mode displays real-time events of the current session, while History mode stores past monitoring data, enabling efficient analysis and long-term review.
Convenient search filters enable fast and accurate detail gathering. Whether you need to filter events by status to identify failed actions, you want to sort sensors by their type to gather the scanned information, or even check the specific device efficiency – all these tasks are made possible with the powerful filtration functionality. Don’t forget to combine filters for maximum work productivity.

Network map
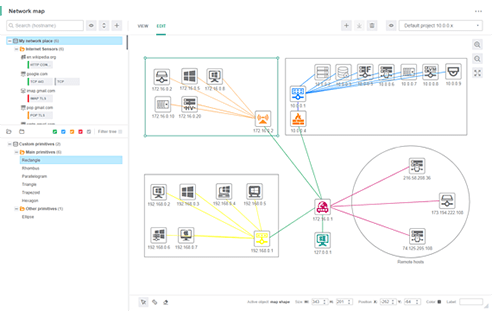
Network mapping software interacts with your network tree visualizing the whole system of linked devices. Network Olympus mapping software is a fully integrated solution for displaying network nodes and efficient interactive device management.

The mapping editor is divided into the following two key sections.
Network tree. This module scans and automatically adds devices to a hierarchical tree, offering comprehensive supervisory capabilities such as organizing devices into structured groups.
Network map. The primary section for editing and visualizing your network. It allows you to create multiple independent maps that display real-time sensor status indicators.
These modules enhance how you interact with your nodes by providing a comprehensive set of visual elements, diagrams, and other graphical tools.
Networking environments are inherently complex, and while you can't eliminate that complexity entirely, Network Olympus creates a convenient infrastructure for network managers to moderate and maintain devices with minimal effort. You can split complicated network maps covering multiple floors into smaller, independent views, so your team can focus on the devices they manage without searching through the entire network. Our mapping tools and widgets make intricate processes simple and clear!
Use cases
The typical use cases for Network Olympus include:
It is a critical metric that directly impacts host performance and responsiveness. A high data center load can lead to slow response times, reduced throughput, and even complete system failure in extreme cases. Monitoring the backend load is essential for several reasons:
Try out our ready-made solution for network monitoring today, and start enjoying your work more than ever before!