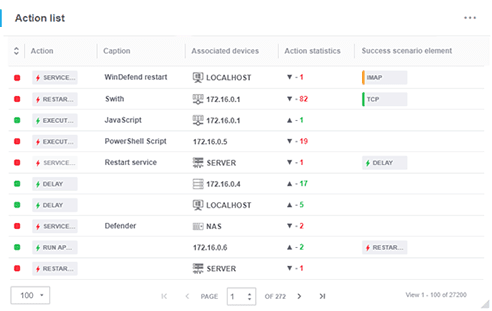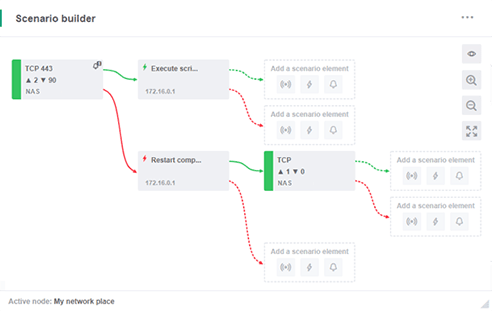
Server health monitoring provides valuable data about the current health of the server and its various components. Continuously monitoring key metrics, such as CPU usage, memory consumption, disk space usage, and network traffic, enables administrators to quickly identify any performance bottlenecks and then take the appropriate action to optimize performance.
Regular monitoring of server health enables administrators to detect and resolve issues before they impact end-users, ensuring a seamless and uninterrupted experience. Moreover, by analyzing historical data and trends, administrators can make informed decisions regarding capacity planning, resource allocation, and infrastructure upgrades, ultimately leading to improved system performance and scalability.
It is a critical metric that directly impacts host performance and responsiveness. A high data center load can lead to slow response times, reduced throughput, and even complete system failure in extreme cases.
Monitoring the backend load is essential for several reasons:
By keeping a close eye on the host load, administrators can identify performance bottlenecks, optimize resource utilization, and ensure that the server is operating at peak efficiency. This, in turn, leads to improved system stability, reduced downtime, and a better overall user experience.

Once the sources of high server load have been identified, administrators can take various steps to reduce the load and improve performance, such as:
Implementing these strategies enables administrators to effectively reduce the load, improve performance, and ensure that the servers are running at peak efficiency.

To effectively monitor server performance and load, administrators can leverage various analysis tools. These tools provide real-time visibility into key performance metrics and offer features such as:
Comprehensive monitoring of server load should include the following types of checks:
Checking network traffic is crucial for identifying bandwidth bottlenecks, detecting unusual traffic patterns, and ensuring optimal network performance. Web server monitoring tools can help track metrics such as requests per second, response times, and error rates.
High CPU usage can indicate the presence of resource-intensive processes or insufficient processing power. Windows tracking and Linux server load monitoring tools can help track CPU utilization and identify processes consuming excessive CPU resources.
Insufficient available memory can lead to performance degradation and even system crashes. Server performance monitoring tools can help track memory usage and identify memory leaks or inefficient memory allocation.
Running out of disk space can cause applications to fail and lead to data loss. Monitoring disk space usage can help administrators proactively identify storage issues and take corrective actions, such as archiving old data or adding additional storage capacity.
Monitoring running processes can help identify resource-intensive or malfunctioning applications that may be impacting server performance. Process tracking tools can provide detailed information about process resource consumption, dependencies, and runtime behavior.
Network Olympus is a powerful and comprehensive server load monitoring solution that empowers administrators to effectively monitor and manage host performance. With its intuitive interface and advanced features, Network Olympus simplifies the process of tracking key performance metrics, identifying potential issues, and taking proactive measures to optimize server health and performance.

Some of the key features and benefits of Network Olympus include:
By leveraging Network Olympus, organizations can ensure optimal server performance, reduce downtime, and improve overall system reliability and user experience. With its comprehensive set of server load monitoring tools and advanced analytics capabilities, Network Olympus empowers administrators to proactively manage node health and performance, enabling them to focus on delivering high-quality services to their users.
You can try the full functionality of Network Olympus for 30 days. If you monitor fewer than 10 devices, you can use the free license with no time limit.